35. 时间序列数据分析处理#
35.1. 介绍#
时间序列是数据分析中经常会遇到的数据类型。了解并掌握相关特征及处理方法,能够帮助我们应对时间序列分析任务。本次实验中,我们重点学习使用 Pandas 对时间序列的一系列预处理技巧。
35.2. 知识点#
时间生成
时间转换
时间计算
时区
时间戳
时间戳索引
时序检索
时序偏移
重采样
时间序列分析是数据分析过程中,尤其是在金融数据分析过程中会经常遇到的。时间序列,就是以时间排序的一组随机变量,例如国家统计局每年或每月定期发布的 GDP 或 CPI 指数;一段时间内股票、基金、指数的数值变化等,都是时间序列。
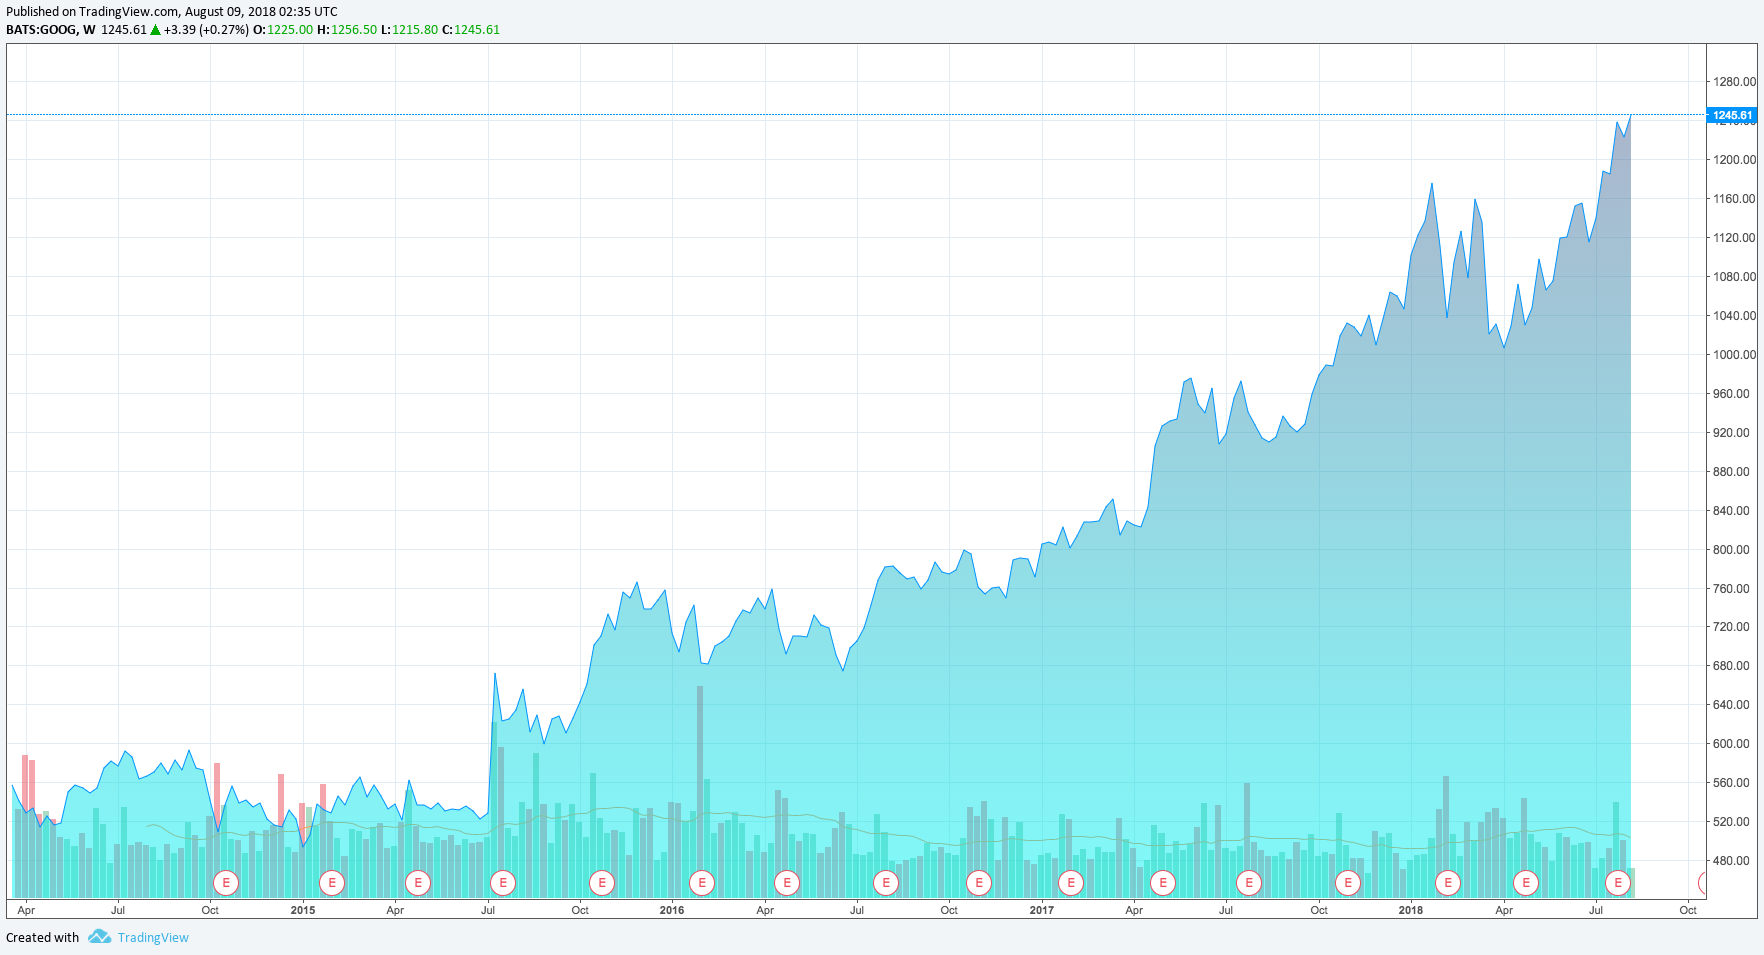
下图呈现了 Google 公司仅 5 年的股价变化曲线。实际上,这条曲线由每天的收盘价绘制而成,这就是一个典型的时间序列数据集。

除了金融领域,时间序列在环境、物理等其他方面都广为存在。例如空气质量指数随时间变化,服务器日志数据随时间的产生。
同样,Pandas 提供了一系列标准的时间序列处理工具和算法,是使用 Python 对时间序列处理分析中必不可缺的法宝。接下来,我们将了解时间的产生,时间序列的生成、索引、切片、采样等内容。
35.3. 时间生成#
在学习时间序列前,首先需要了解时间。Python
中,我们通常会使用
datetime,time
模块来完成时间操作。例如,datetime.datetime.now
可以打印出当前时间。
import datetime

datetime.datetime.now()  # 获取当前时间
datetime.datetime(2023, 11, 11, 13, 36, 28, 1146)
可以看到,datetime.datetime.now()
返回了一个时间对象,依次为:年、月、日、时、分、秒、毫秒。其中,毫秒的取值范围在
0
                      <=
                      microsecond
                      <
1000000。datetime.datetime.now()
还有一个等效方法为
datetime.datetime.today()。
datetime.datetime.today() # 获取当前时间
datetime.datetime(2023, 11, 11, 13, 36, 28, 15287)
你可以选择只返回时间的一部分。
datetime.datetime.now().year # 返回当前年份
2023
除了获取当前时间,你可以手动指定时间对象。
datetime.datetime(2017, 10, 1, 10, 59, 30) # 指定任意时间
datetime.datetime(2017, 10, 1, 10, 59, 30)
35.4. 时间计算#
datetime
时间对象是可以参与计算的。比如增加一定时间和年份,年份间隔计算等。
datetime.datetime(2018, 10, 1) - datetime.datetime(2017, 10, 1) # 计算时间间隔
datetime.timedelta(days=365)
可以看到,上面返回了
datetime.timedelta
对象。timedelta
可以用于表示时间上的不同,但最多只保留 3
位,分别是:天、秒、毫秒。例如:
datetime.datetime.now() - datetime.datetime(2017, 10, 1) # timedelta 表示间隔时间
datetime.timedelta(days=2232, seconds=48988, microseconds=37705)
所以,如果要在当前时间上增加一年。你需要将年份转换为天来计算。
datetime.datetime.now() + datetime.timedelta(365) # 需将年份转换为天
datetime.datetime(2024, 11, 10, 13, 36, 28, 41982)
35.5. 时间格式转换#
datetime
对象固然精确,但很多时间我们想将其转换为自定义的时间表示样式,例如:2018
年 10
月 1
日,或者
2018/10/1
等。此时,就需要将
datetime
对象转换为字符串对象了。
我们可以使用
datetime.date.strftime
来完成时间与字符串之间的转换。
datetime.datetime.now().strftime("%Y-%m-%d") # 转换为自定义样式
'2023-11-11'
datetime.datetime.now().strftime("%Y 年 %m 月 %d 日") # 转换为自定义样式
'2023 年 11 月 11 日'
你会发现我们使用到了占位符。那么,strftime
支持的占位符有:
-
%y两位数的年份表示(00-99) -
%Y四位数的年份表示(000-9999) -
%m月份(01 - 12) -
%d月内中的一天(0 - 31) -
%H24 小时制小时数(0 - 23) -
%I12 小时制小时数(01 - 12) -
%M分钟数(00 - 59) -
%S秒(00 - 59) -
%a本地简化星期名称 -
%A本地完整星期名称 -
%b本地简化的月份名称 -
%B本地完整的月份名称 -
%c本地相应的日期表示和时间表示 -
%j年内的一天(001 - 366) -
%p本地 A.M. 或 P.M. 的等价符 -
%U一年中的星期数(00 - 53)星期天为星期的开始 -
%w星期(0 - 6),星期天为星期的开始 -
%W一年中的星期数(00 - 53)星期一为星期的开始 -
%x本地相应的日期表示 -
%X本地相应的时间表示 -
%Z当前时区的名称
除了
datetime
对象转换为字符串,你也可以将字符串时间转换为
datetime
对象。此项操作主要是考虑到
datetime
对象的灵活性,可以进行二次转换使用。例如,你只需要用占位符表示出原字符串的规则,就能自动将其转换为
datetime
时间对象,非常方便。
datetime.datetime.strptime("2018-10-1", "%Y-%m-%d")
datetime.datetime(2018, 10, 1, 0, 0)
35.6. 时区#
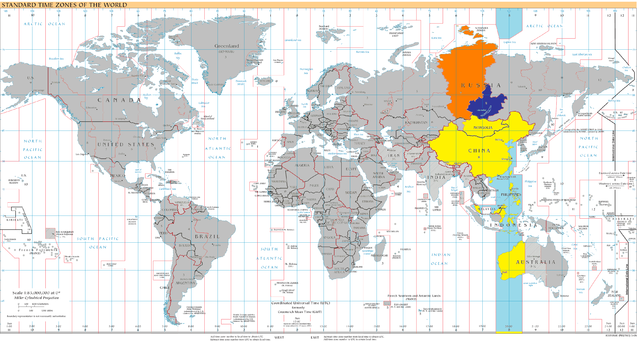
时区是地球上的区域使用同一个时间的定义。如果时间是以协调世界时(UTC)表示,那么我们就可以使用 UTC 偏移量来定义不同时区的时间。例如,因为北京位于东八区,那么北京时间就是 UTC +08:00,其代表比协调世界时快 8 小时的时区。

当我们使用
datetime.now()
打印出来当前的时间时,是不包含时区信息的。这也被称之为 Naive
datetime object,即「朴素时区」。我们可以通过
datetime.datetime.utcnow()
来获取 UTC 时间。
datetime.datetime.utcnow() # 获取 UTC 时间
datetime.datetime(2023, 11, 11, 5, 36, 28, 59689)
那么,此时如果要获取北京时间,就可以 UTC+8:00。
utc = datetime.datetime.utcnow()  # 获取 UTC 时间
tzutc_8 = datetime.timezone(datetime.timedelta(hours=8))  # + 8 小时
utc_8 = utc.astimezone(tzutc_8)  # 添加到时区中
print(utc_8)
2023-11-11 05:36:28.063327+08:00
上面介绍了时间,如果我们将时间和采集到的数据对应起来,就组成了时间序列。在一个时间序列中,主要存在两种类型:
时间戳:单个时刻。
-
时间间隔:由开始时间戳到结束时间戳组成,有的时间间隔可以是一个时期,例如 2018 年,代表整年的时间间隔。
接下来,我们学习使用 Pandas 处理时间序列的方法。
35.7. 时间戳 Timestamp#
时间戳,即代表一个时间时刻。Pandas 中,我们可以直接用
pandas.Timestamp
来创建时间戳。
import pandas as pd

pd.Timestamp("2018-10-1")
Timestamp('2018-10-01 00:00:00')
或者结合
datetime
模块创建时间戳。
pd.Timestamp(datetime.datetime.now())
Timestamp('2023-11-11 13:36:28.350028')
除此之外,我们还可以使用
pandas.to_datetime
来创建时间戳,例如:
pd.to_datetime("1-10-2018")
Timestamp('2018-01-10 00:00:00')
上面默认创建了
2018-01-10
的时间戳,如果想要其变成
2018-10-1
呢?可以通过
dayfirst=True
参数进行修正。
pd.to_datetime("1-10-2018", dayfirst=True)
Timestamp('2018-10-01 00:00:00')
35.8. 时间索引 DatetimeIndex#
时间戳 Timestamp 并不是在时间序列中经常遇到的类型。如果我们拿到一个由时间排序的数据表,那么更重要的数据类型是 DatetimeIndex。顾名思义,时间索引就是由一系列时间戳组成,不过在 Pandas 中的数据类型为 DatetimeIndex。
我们同样可以使用
pd.to_datetime()
来创建时间索引。与上方创建时间戳不同的地方在于,你只需要输入包含多个时刻的列表即可。
pd.to_datetime(["2018-10-1", "2018-10-2", "2018-10-3"]) # 生成时间索引
DatetimeIndex(['2018-10-01', '2018-10-02', '2018-10-03'], dtype='datetime64[ns]', freq=None)
当然,Pandas 的 Seris 和 DataFrame 也可以直接通过
to_datetime
转换。
s = pd.Series(["2018-10-1", "2018-10-2", "2018-10-3"])
pd.to_datetime(s)  # 将 Seris 中字符串转换为时间
0   2018-10-01
1   2018-10-02
2   2018-10-03
dtype: datetime64[ns]
这里值得注意的是,原 Series 中的时间是字符串,经过
pd.to_datetime()
转换之后变成了
datetime64
时间。但并不是严格意义上的时间索引,而时间索引是需要将其放到
Series 或 DataFrame 的索引位置才行。例如:
pd.Series(index=pd.to_datetime(s)).index # 当时间位于索引时,就是 DatetimeIndex
DatetimeIndex(['2018-10-01', '2018-10-02', '2018-10-03'], dtype='datetime64[ns]', freq=None)
现在看到的就是 DatetimeIndex 类型了。
事实上,生成 DatetimeIndex 另一个更常用的方法是
pandas.date_range。我们可以通过指定规则,让
pandas.date_range
生成有序的 DatetimeIndex。
date_range
方法带有的默认参数如下:
pandas.date_range(start=None, end=None, periods=None, freq=’D’, tz=None, normalize=False, name=None, closed=None, **kwargs)
其中:
-
start=:设置起始时间 -
end=:设置截至时间 -
periods=:设置时间区间,若None则需要单独设置起止和截至时间。 -
freq=:设置间隔周期。 -
tz=:设置时区。
特别地,freq=
频度参数非常关键,可以设置的周期有:
-
freq='s': 秒 -
freq='min': 分钟 -
freq='H': 小时 -
freq='D': 天 -
freq='w': 周 -
freq='m': 月 -
freq='BM': 每个月最后一天 -
freq='W':每周的星期日
pd.date_range("2018-10-1", "2018-10-2", freq="H") # 按小时间隔生成时间索引
DatetimeIndex(['2018-10-01 00:00:00', '2018-10-01 01:00:00',
               '2018-10-01 02:00:00', '2018-10-01 03:00:00',
               '2018-10-01 04:00:00', '2018-10-01 05:00:00',
               '2018-10-01 06:00:00', '2018-10-01 07:00:00',
               '2018-10-01 08:00:00', '2018-10-01 09:00:00',
               '2018-10-01 10:00:00', '2018-10-01 11:00:00',
               '2018-10-01 12:00:00', '2018-10-01 13:00:00',
               '2018-10-01 14:00:00', '2018-10-01 15:00:00',
               '2018-10-01 16:00:00', '2018-10-01 17:00:00',
               '2018-10-01 18:00:00', '2018-10-01 19:00:00',
               '2018-10-01 20:00:00', '2018-10-01 21:00:00',
               '2018-10-01 22:00:00', '2018-10-01 23:00:00',
               '2018-10-02 00:00:00'],
              dtype='datetime64[ns]', freq='H')
# 从 2018-10-1 开始,以天为间隔,向后推 10 次
pd.date_range("2018-10-1", periods=10, freq="D")
DatetimeIndex(['2018-10-01', '2018-10-02', '2018-10-03', '2018-10-04',
               '2018-10-05', '2018-10-06', '2018-10-07', '2018-10-08',
               '2018-10-09', '2018-10-10'],
              dtype='datetime64[ns]', freq='D')
# 从 2018-10-1 开始,以 1H20min 为间隔,向后推 10 次
pd.date_range("2018-10-1", periods=10, freq="1H20min")
DatetimeIndex(['2018-10-01 00:00:00', '2018-10-01 01:20:00',
               '2018-10-01 02:40:00', '2018-10-01 04:00:00',
               '2018-10-01 05:20:00', '2018-10-01 06:40:00',
               '2018-10-01 08:00:00', '2018-10-01 09:20:00',
               '2018-10-01 10:40:00', '2018-10-01 12:00:00'],
              dtype='datetime64[ns]', freq='80T')
通过
date_range,我们可以生成任何以一定规律变化的时间索引。
前面,我们了解了
timedelta
可以用于时间运算。而在 DatetimeIndex 中,我们可以通过 offset
对象对时间戳索引进行更加灵活的变化。例如:
可以让时间索引增加或减少一定时间段。
可以让时间索引乘以一个整数。
-
可以让时间索引向前或向后移动到下一个或上一个特定的偏移日期。
time_index = pd.date_range("2018-10-1", periods=10, freq="1D1H")
time_index
DatetimeIndex(['2018-10-01 00:00:00', '2018-10-02 01:00:00',
               '2018-10-03 02:00:00', '2018-10-04 03:00:00',
               '2018-10-05 04:00:00', '2018-10-06 05:00:00',
               '2018-10-07 06:00:00', '2018-10-08 07:00:00',
               '2018-10-09 08:00:00', '2018-10-10 09:00:00'],
              dtype='datetime64[ns]', freq='25H')
使用 offset 对象让
time_index
依次增加 1 个月 + 2 天 + 3 小时。
from pandas import offsets

time_index + offsets.DateOffset(months=1, days=2, hours=3)
DatetimeIndex(['2018-11-03 03:00:00', '2018-11-04 04:00:00',
               '2018-11-05 05:00:00', '2018-11-06 06:00:00',
               '2018-11-07 07:00:00', '2018-11-08 08:00:00',
               '2018-11-09 09:00:00', '2018-11-10 10:00:00',
               '2018-11-11 11:00:00', '2018-11-12 12:00:00'],
              dtype='datetime64[ns]', freq=None)
或者,使用 offset 对象让
time_index
向后偏移 2 周。
time_index + 2 * offsets.Week()
DatetimeIndex(['2018-10-15 00:00:00', '2018-10-16 01:00:00',
               '2018-10-17 02:00:00', '2018-10-18 03:00:00',
               '2018-10-19 04:00:00', '2018-10-20 05:00:00',
               '2018-10-21 06:00:00', '2018-10-22 07:00:00',
               '2018-10-23 08:00:00', '2018-10-24 09:00:00'],
              dtype='datetime64[ns]', freq=None)
除了示例中提到的
offsets.DateOffset
和
offsets.Week,常用的 offsets 对象还有:
|
DateOffset 名称 |
描述 |
|---|---|
DateOffset |
自定义,默认一周 |
BDay |
工作日 |
CDay |
自定义工作日 |
MonthEnd |
月末 |
QuarterEnd |
季度结束 |
YearEnd |
年末 |
更详细的 DateOffset Objects 表单可以阅读官方文档。
你可以发现,DateOffset 对象非常灵活,只要稍加组合,就能实现任意想要的时间偏移结果。实际上,DateOffset 对象不仅对 DatetimeIndex 有效,对于时间戳 Timestamp 也是可以操作的。这一点应该很好理解,比较 DatetimeIndex 相当于 Timestamp 的延展。
35.9. 时间间隔 Periods#
上面,我们对 Timestamp 时间戳和 DatetimeIndex 时间戳索引都有了较为充分的认识。除此之外 Pandas 中还存在 Period 时间间隔和 PeriodIndex 时间间隔索引对象。什么是 Periods?比如:天,月,季,年。
# 1 年跨度
pd.Period("2018")
Period('2018', 'A-DEC')
# 1 个月跨度
pd.Period("2018-1")
Period('2018-01', 'M')
# 1 天跨度
pd.Period("2018-1-1")
Period('2018-01-01', 'D')
你会看到,每一个时间间隔后面都有一个字母,其实这就是时间间隔所对应的
freq=
频度。你可能在想,Periods 看起来和上面的 Timestamp
没有区别呢?那我们重新生成一个 Timestamp 看一看。
pd.Timestamp("2018-1-1")
Timestamp('2018-01-01 00:00:00')
此时,你应该能发现 Timestamp 和 Periods 的区别了吧。Periods
代表是
2018-01-01
这一天,而 Timestamp 仅代表
2018-01-01
                      00:00:00
这一时刻。
35.10. 时间间隔索引 PeriodsIndex#
与「时间戳 → 时间索引」相仿,时间间隔也对应着时间间隔索引
PeriodsIndex。而我们可以通过
pandas.period_range()
方法来生成索引序列。
p = pd.period_range("2018", "2019", freq="M")  # 生成 2018-1 到 2019-1 序列,按月分布
p
PeriodIndex(['2018-01', '2018-02', '2018-03', '2018-04', '2018-05', '2018-06',
             '2018-07', '2018-08', '2018-09', '2018-10', '2018-11', '2018-12',
             '2019-01'],
            dtype='period[M]')
生成索引序列时,就必须指定
freq=
频度,这和上文生成 DatetimeIndex 时相似。同时,我们可以使用
asfreq 来重新设定频度。
p.asfreq(freq="D", how="S") # 频度从 M → D
PeriodIndex(['2018-01-01', '2018-02-01', '2018-03-01', '2018-04-01',
             '2018-05-01', '2018-06-01', '2018-07-01', '2018-08-01',
             '2018-09-01', '2018-10-01', '2018-11-01', '2018-12-01',
             '2019-01-01'],
            dtype='period[D]')
这里的
how=S
代表每月的第一天(Start),也可以设为
how=E(End)。
35.11. 时序数据选择、切片、偏移#
你或许在纳闷,Pandas 为什么要使用时间戳,时间索引,时间间隔等呢?实际上,这些基础数据类型都是方便我们对时间序列数据进行操作而出现的。有了 Timestamp 和 Periods,我们就可以完成对数据的选择、切片,以及进行偏移、重新采样等更为复杂的组合变换了。
下面,我们尝试生成包含时间索引的 Series 示例,并对数据进行选择。
import numpy as np

timeindex = pd.date_range("2018-1-1", periods=20, freq="M")
s = pd.Series(np.random.randn(len(timeindex)), index=timeindex)
s
2018-01-31    0.330330
2018-02-28    1.087339
2018-03-31   -1.486658
2018-04-30    0.783250
2018-05-31    1.527258
2018-06-30    0.152985
2018-07-31   -0.310307
2018-08-31   -0.839569
2018-09-30   -1.905840
2018-10-31    0.542714
2018-11-30   -0.083846
2018-12-31    0.330400
2019-01-31   -0.475228
2019-02-28   -0.871950
2019-03-31   -1.174331
2019-04-30    0.095896
2019-05-31    0.353876
2019-06-30    0.159181
2019-07-31    0.759272
2019-08-31   -1.708107
Freq: M, dtype: float64
选择 2018 年的所有数据。
s["2018"]
2018-01-31    0.330330
2018-02-28    1.087339
2018-03-31   -1.486658
2018-04-30    0.783250
2018-05-31    1.527258
2018-06-30    0.152985
2018-07-31   -0.310307
2018-08-31   -0.839569
2018-09-30   -1.905840
2018-10-31    0.542714
2018-11-30   -0.083846
2018-12-31    0.330400
Freq: M, dtype: float64
选择 2018 年 7 月到 2019 年 3 月之间的所有数据。
s["2018-07":"2019-03"]
2018-07-31   -0.310307
2018-08-31   -0.839569
2018-09-30   -1.905840
2018-10-31    0.542714
2018-11-30   -0.083846
2018-12-31    0.330400
2019-01-31   -0.475228
2019-02-28   -0.871950
2019-03-31   -1.174331
Freq: M, dtype: float64
除了查询和切片,我们还可以用到 Shifting 方法,将时间索引进行整体偏移。
s.shift(3) # 时间索引以默认 Freq: M 向后偏移 3 个单位
2018-01-31         NaN
2018-02-28         NaN
2018-03-31         NaN
2018-04-30    0.330330
2018-05-31    1.087339
2018-06-30   -1.486658
2018-07-31    0.783250
2018-08-31    1.527258
2018-09-30    0.152985
2018-10-31   -0.310307
2018-11-30   -0.839569
2018-12-31   -1.905840
2019-01-31    0.542714
2019-02-28   -0.083846
2019-03-31    0.330400
2019-04-30   -0.475228
2019-05-31   -0.871950
2019-06-30   -1.174331
2019-07-31    0.095896
2019-08-31    0.353876
Freq: M, dtype: float64
你可以把上面的过程理解为时间索引向后(未来)位移 3
个单位,缺失数据 Pandas 会用 NaN
自动填充。除此之外,还可以指定
freq=
参数,确定偏移的单位大小。
s.shift(-3, freq="D") # 时间索引以 Freq: D 向前偏移 3 个单位
2018-01-28    0.330330
2018-02-25    1.087339
2018-03-28   -1.486658
2018-04-27    0.783250
2018-05-28    1.527258
2018-06-27    0.152985
2018-07-28   -0.310307
2018-08-28   -0.839569
2018-09-27   -1.905840
2018-10-28    0.542714
2018-11-27   -0.083846
2018-12-28    0.330400
2019-01-28   -0.475228
2019-02-25   -0.871950
2019-03-28   -1.174331
2019-04-27    0.095896
2019-05-28    0.353876
2019-06-27    0.159181
2019-07-28    0.759272
2019-08-28   -1.708107
dtype: float64
35.12. 时序数据重采样#
重采样是时序数据处理中经常会使用到的操作。Resample 的目的是提升或降低一个时间索引序列的频率。例如:当时间序列数据量非常大时,我们可以通过低频率采样的方法得到规模较小到时间覆盖依然较为全面的新数据集。另外,对于多个不同频率的数据集需要数据对齐时,重采样可以十分重要的手段。
同样,初始化一个示例 Series。
dateindex = pd.period_range("2018-10-1", periods=20, freq="D")
s = pd.Series(np.random.randn(len(dateindex)), index=dateindex)
s
2018-10-01   -0.375011
2018-10-02    1.052191
2018-10-03   -0.232303
2018-10-04   -1.632577
2018-10-05   -0.362599
2018-10-06   -0.866722
2018-10-07   -0.244350
2018-10-08    1.501014
2018-10-09    0.558769
2018-10-10   -2.173344
2018-10-11    0.112917
2018-10-12    2.078360
2018-10-13    1.596991
2018-10-14   -0.098130
2018-10-15   -0.175248
2018-10-16    0.184979
2018-10-17   -0.223399
2018-10-18    0.427384
2018-10-19    0.170283
2018-10-20   -0.234324
Freq: D, dtype: float64
下面,我们对 Series 按照 2 天进行降采样,并对 2
天对应的数据求和作为新数据。注意,这里执行
pandas.DataFrame.resample
降频采样时需要选择一个计算方法(求和、求平均、最大值、最小值等)。
s.resample("2D").sum() # 降采样,并将删去的数据依次合并到保留数据中
2018-10-01    0.677181
2018-10-03   -1.864881
2018-10-05   -1.229321
2018-10-07    1.256664
2018-10-09   -1.614575
2018-10-11    2.191277
2018-10-13    1.498861
2018-10-15    0.009731
2018-10-17    0.203986
2018-10-19   -0.064040
Freq: 2D, dtype: float64
那么,如果降采样时并不想对数据索引对应的数据进行操作,而仅仅保留原时间戳对应的数据。可以使用
.asfreq()
方法。
s.resample("2D").asfreq() # 降采样,直接舍去数据
2018-10-01   -0.375011
2018-10-03   -0.232303
2018-10-05   -0.362599
2018-10-07   -0.244350
2018-10-09    0.558769
2018-10-11    0.112917
2018-10-13    1.596991
2018-10-15   -0.175248
2018-10-17   -0.223399
2018-10-19    0.170283
Freq: 2D, dtype: float64
还可以这样,按照 2 天进行降采样,并将对应 2
天数据的原值、最大值、最小值等列出。而这个方法主要用于股票分析中,其中,open、high、low、close
也就对应着股票交易过程中的开盘、最高、最低以及收盘价。
s.resample("2D").ohlc()
| open | high | low | close | |
|---|---|---|---|---|
| 2018-10-01 | -0.375011 | 1.052191 | -0.375011 | 1.052191 |
| 2018-10-03 | -0.232303 | -0.232303 | -1.632577 | -1.632577 |
| 2018-10-05 | -0.362599 | -0.362599 | -0.866722 | -0.866722 |
| 2018-10-07 | -0.244350 | 1.501014 | -0.244350 | 1.501014 |
| 2018-10-09 | 0.558769 | 0.558769 | -2.173344 | -2.173344 |
| 2018-10-11 | 0.112917 | 2.078360 | 0.112917 | 2.078360 |
| 2018-10-13 | 1.596991 | 1.596991 | -0.098130 | -0.098130 |
| 2018-10-15 | -0.175248 | 0.184979 | -0.175248 | 0.184979 |
| 2018-10-17 | -0.223399 | 0.427384 | -0.223399 | 0.427384 |
| 2018-10-19 | 0.170283 | 0.170283 | -0.234324 | -0.234324 |
除了降采样,升采样同样可行。不过,我们要考虑到升采样时,新增加到时间索引中的时间戳对应的数值怎么办?是沿用临近数据,还是其他方法填充?
例如,我们可以让时间频率从天提升到小时,并使用相同的数据对新增加行填充。
s.resample("H").ffill() # 升采样,使用相同的数据对新增加行填充
2018-10-01 00:00   -0.375011
2018-10-01 01:00   -0.375011
2018-10-01 02:00   -0.375011
2018-10-01 03:00   -0.375011
2018-10-01 04:00   -0.375011
                      ...
2018-10-20 19:00   -0.234324
2018-10-20 20:00   -0.234324
2018-10-20 21:00   -0.234324
2018-10-20 22:00   -0.234324
2018-10-20 23:00   -0.234324
Freq: H, Length: 480, dtype: float64
通过设置
limit=
控制填充的最大数目,而不填充的数值将自动标记为 NaN。
s.resample("H").ffill(limit=3) # 升采样,最多填充临近 3 行
2018-10-01 00:00   -0.375011
2018-10-01 01:00   -0.375011
2018-10-01 02:00   -0.375011
2018-10-01 03:00   -0.375011
2018-10-01 04:00         NaN
                      ...
2018-10-20 19:00         NaN
2018-10-20 20:00         NaN
2018-10-20 21:00         NaN
2018-10-20 22:00         NaN
2018-10-20 23:00         NaN
Freq: H, Length: 480, dtype: float64
35.13. 时序数据时区处理#
上面,我们了解了 datetime 中的时区处理,而在 Pandas 可能也会遇到时区处理的情况。与 datetime 相似,Pandas 中的时间序列依旧是朴素时区。
naive_time = pd.date_range("1/10/2018 9:00", periods=10, freq="D")
naive_time
DatetimeIndex(['2018-01-10 09:00:00', '2018-01-11 09:00:00',
               '2018-01-12 09:00:00', '2018-01-13 09:00:00',
               '2018-01-14 09:00:00', '2018-01-15 09:00:00',
               '2018-01-16 09:00:00', '2018-01-17 09:00:00',
               '2018-01-18 09:00:00', '2018-01-19 09:00:00'],
              dtype='datetime64[ns]', freq='D')
所以,当我们需要转换为本地时间,就需要先向时间序列添加 UTC 时区信息,再转换为本地时间。
utc_time = naive_time.tz_localize("UTC")
utc_time
DatetimeIndex(['2018-01-10 09:00:00+00:00', '2018-01-11 09:00:00+00:00',
               '2018-01-12 09:00:00+00:00', '2018-01-13 09:00:00+00:00',
               '2018-01-14 09:00:00+00:00', '2018-01-15 09:00:00+00:00',
               '2018-01-16 09:00:00+00:00', '2018-01-17 09:00:00+00:00',
               '2018-01-18 09:00:00+00:00', '2018-01-19 09:00:00+00:00'],
              dtype='datetime64[ns, UTC]', freq='D')
接下来,我们使用
tz_localize
方法实现时区转换。
utc_time.tz_convert("Asia/Shanghai")
DatetimeIndex(['2018-01-10 17:00:00+08:00', '2018-01-11 17:00:00+08:00',
               '2018-01-12 17:00:00+08:00', '2018-01-13 17:00:00+08:00',
               '2018-01-14 17:00:00+08:00', '2018-01-15 17:00:00+08:00',
               '2018-01-16 17:00:00+08:00', '2018-01-17 17:00:00+08:00',
               '2018-01-18 17:00:00+08:00', '2018-01-19 17:00:00+08:00'],
              dtype='datetime64[ns, Asia/Shanghai]', freq='D')
注意,一般我们定义
UTC+8:00
时会使用
Asia/Chongqing
或
Asia/Shanghai,没有
Asia/Beijing。具体是因为历史遗留原因。
实际上,你可以在生成时间戳或者时间索引时,指定
tz=
参数来定义 UTC 时区。
pd.date_range("1/10/2018 9:00", periods=10, freq="D", tz="Asia/Shanghai")
DatetimeIndex(['2018-01-10 09:00:00+08:00', '2018-01-11 09:00:00+08:00',
               '2018-01-12 09:00:00+08:00', '2018-01-13 09:00:00+08:00',
               '2018-01-14 09:00:00+08:00', '2018-01-15 09:00:00+08:00',
               '2018-01-16 09:00:00+08:00', '2018-01-17 09:00:00+08:00',
               '2018-01-18 09:00:00+08:00', '2018-01-19 09:00:00+08:00'],
              dtype='datetime64[ns, Asia/Shanghai]', freq='D')
但需注意,由于 UTC 时间的基准发生了变化(tz=
会将指定时间作为 UTC),所以上一行结果与前面通过
tz_convert
的转换结果有所不同。
35.14. 总结#
时间序列,无非就是一系列按照时间点采样的数据,形式简单。本次实验中,我们了解了时间序列数据在 Pandas 中的基本要素,学习了 Pandas 处理时间序列数据的方法和技巧。只有掌握了这些方法,才能更好地玩转时间序列数据,从中挖掘出有价值的信息。

○ 欢迎分享本文链接到你的社交账号、博客、论坛等。更多的外链会增加搜索引擎对本站收录的权重,从而让更多人看到这些内容。
